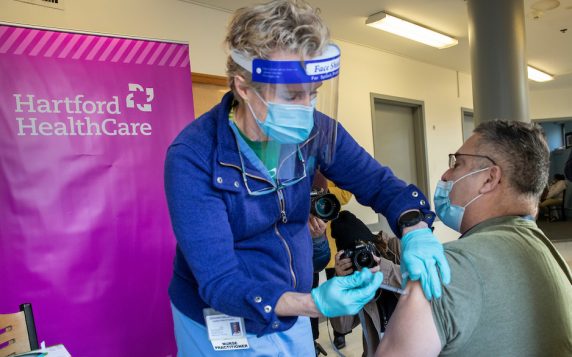
The safest place to live in the United States, at least where risk of serious COVID-related illness and death is lowest because of high vaccination rates, is New England.
New England swept the Top 5 spots in the Centers for Disease Control and Prevention’s list of states with the highest percentage of population fully vaccinated against the coronavirus. Connecticut, with more than 69 percent of its population fully vaccinated, ranks second nationally.
Here are the latests numbers, updated Wednesday morning:
- Vermont
Number of people fully vaccinated: 435,247
Percentage of population fully vaccinated: 69.75 - Connecticut
Number of people fully vaccinated: 2,464,693
Percentage of population fully vaccinated: 69.13 - Rhode Island
Number of people fully vaccinated: 728,787
Percentage of population fully vaccinated: 68.79 - Maine
Number of people fully vaccinated: 924,131
Percentage of population fully vaccinated: 68.75 - Massachusetts
Number of people fully vaccinated: 4,702,253
Percentage of population fully vaccinated: 68.22
“Connecticut, in many ways, has led the country in achieving a higher vaccination rate,” says Dr. Ajay Kumar, Hartford HealthCare’s Chief Clinical Officer. “We’re seeing some positive signs of that consistently. But we still continue to see a fair amount of patients admitted to the hospital who are unvaccinated. We do have vaccinated individuals in the hospital who have had breakthrough infections. However, some of [the hospitalizations] are unrelated to COVID. They’re coming here for other reasons.”
Here’s a closer look at COVID in Connecticut, with wide-angle details on town-by-town cases, deaths and cases since the pandemic began and, in the second map, the current case rate the past two weeks in each town. (Data updated today.)
COVID-19 Cases, Deaths and Tests by Town
This map, provided by the state Department of Public Health, shows COVID-19 cases, deaths and tests in Connecticut since the beginning of the pandemic. Darker colors indicate towns with more cases. Hover over a town for detailed information.
Daily Rate of COVID-19 Cases By Town in the Past Two Weeks
This map, provided by the state Department of Public Health, shows the average daily rate of new COVID-19 cases per 100,000 population by town during the past two weeks. Hover over a town to see the number of new cases and case rate (the average daily number of new cases per 100,000 population).


