
The 2017 National Diabetes Statistic Report, released earlier this year by the Centers for Disease Control and Prevention, was created for a scientific audience. But these highlights (the report used 2015 data) and informational graphic should give consumers something to think about during National Diabetes Month.
One note of encouragement: The previous report (2014) estimated 29.1 million Americans, or 9.3 percent of the population, had diabetes. As you’ll see, the prevalence of diabetes in the U.S. has stabilized. Also, see below for prevalence of diabetes in Connecticut, by county.
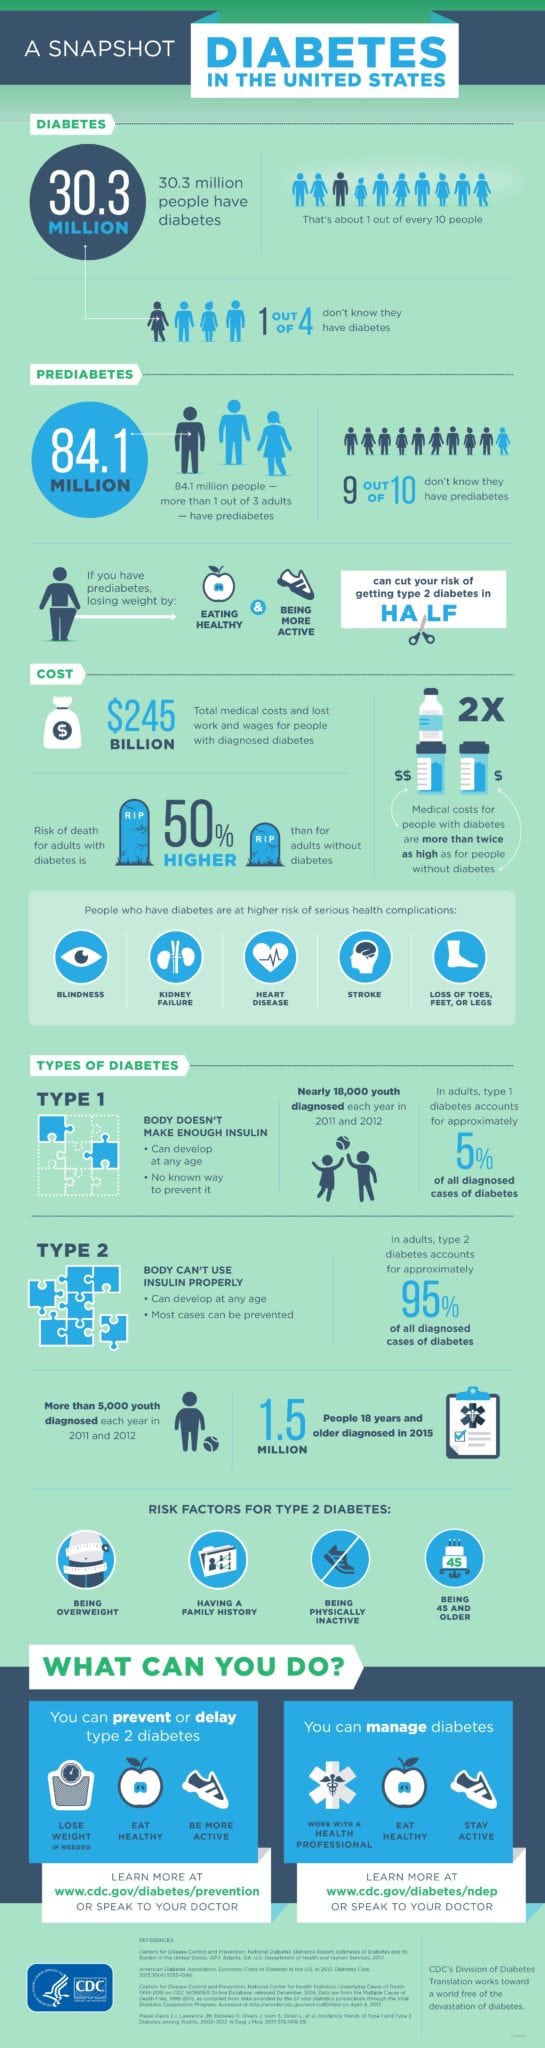
Number of people in the United States with diabetes: 30.3 million (9.4 percent of the population).
Number of people in the United States with prediabetes: 84.1 million.
Number of U.S. adults aged 18 years or older with diabetes: 30.2 million.
Percentage of adults aged 65 or older who have diabetes: 25.2.
Percentage of people with diabetes who have Type 1 diabetes: 5
Highest prevalence of diagnosed men (18 or older): American Indians/Alaska Natives (14.9 percent).
Highest prevalence of diagnosed women (18 or older): American Indians/Alaska Natives (15.3 percent).
Percentage of adults with less than a high school education diagnosed with diabetes: 12.6 percent.
Percentage of adults with a high school education diagnosed with diabetes: 9.5 percent percent.
Percentage of adults with more than a high school education diagnosed with diabetes: 7.2 percent percent.
Number of new cases diagnosed in 2015: 1.5 million (more than half in adults aged 45 to 64).
Risk factors: Overweight and Obesity (87.5 percent had diabetes), high blood pressure (73.6 percent), high cholesterol (58.2), physical inactivity (40.8 percent), smoking (15.9 percent), high blood glucose (15.6 percent).
Cause of death: Diabetes was the seventh-leading cause of death in the United States in 2015.
Diabetes In Connecticut
Diagnosed diabetes cases among adults, age-adjusted percentage, in the state by county (2013 data):
- Windham (9.0)
- Hartford (8.5)
- New London (8.1)
- New Haven (8.0)
- Middlesex (7.0)
- Fairfield (6.7)
- Tolland (6.6)
- Litchfield (5.3)
For more information about diabetes, click here.